
Hangry Bees
Pollen dearth impacts honey bee behaviour and physiology
A recent paper by Elizabeth M. Walsh et al. (2026) looked at how nutritional protein deficiency affected a honey bee colony. A pollen dearth was simulated in one half of their experimental colonies by robbing foragers of their pollen loads, the primary source of protein. The pollen was removed by a pollen trap placed at the entrances to the hives. Temperament assays were then taken of each colony every week, along with the control colonies that were not being deprived of their pollen. At the same time, the plant species that were being foraged were identified and various physiological measures of honey bee nutritional status, including gland size, lipid (fat) levels and gene expression, were recorded in order to further investigate and perhaps explain bee behaviour.
How did the bees respond?
They found that pollen-deprived bees reacted by becoming more defensive and that immature bees likely receive cues during rearing which cause some different gene expressions and ultimately behaviour as adult bees. This suggests that environmental stress caused significant behavioural changes.
Temperament is believed, in the literature, to be primarily associated with genotype (race) of bees, but this work has shown that there are environmental cues that are less acknowledged that affect bee behaviour significantly.
As drought becomes increasingly frequent and the food resource has a temporary dearth, the impact on the behaviour of honey bees will become increasingly noticed.
What does this mean for selection?
For the beekeeper, it is important to understand that, when selecting for breeding queens, the availability of protein (pollen) should be considered alongside temperament. Also, as noted in the accompanying article on water dynamics, the impact of temperature should be noted, as this is another environmental factor that will need to be overcome by any super honey bee we wish to try and breed.
How was defensiveness measured?
It is interesting to note the assay used to determine aggression. A rating was created from observing a colony over two minutes, noting four specific behaviours:
- The degree of stinging.
- The propensity of bees to hang from the comb.
- The running speed across the comb.
- The tendency of bees to fly around the observer.
This assay was conducted at the same time by the same observer one day a week, on the same day.
What the graph shows
The graph is taken from the paper and shows that pollen-deprived colonies had higher defensive assay scores than control colonies.
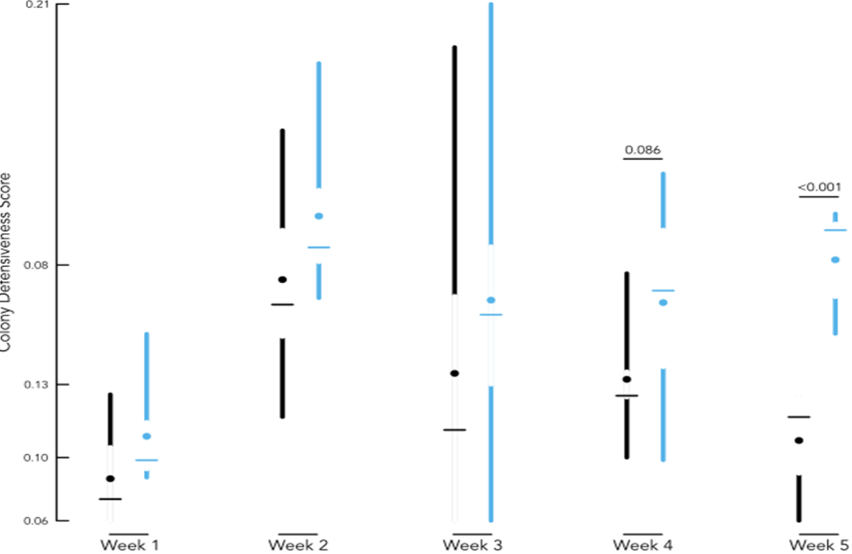
The figure illustrates the distribution of factor scores across the sampling timeline and between control (black) and pollen-deprived (light blue) colonies. Across all observations (N = 75), the x-axis denotes discrete time points and the y-axis provides the defensive score. The y-axis extends from the lowest to the highest score obtained in the data set, and tick marks are made at each quartile. For each group, segments extend from minima to maxima with gaps bounding the interquartile range of the data, circles identify the mean, and horizontal bars identify the median. The reader should consider the median to be the measure they should consider. Trending and significant time points are indicated with the p-value above the week. Pollen-deprived colonies showed a trend towards more aggressive behaviour than control colonies in Week 4. Pollen-deprived colonies were significantly more aggressive than control colonies in Week 5.
The take-home message
The take-home message is that after a few weeks the protein-deprived bees become significantly more aggressive.
The paper went on to identify genes associated with the aggressive behaviour, which will almost certainly be used by future research and for the creation of more tolerant races of honey bees.
Reference
Walsh, E. M. et al. (2026). https://doi.org/10.1371/journal.pone.0338712